

The Threshold Monitoring app analyzes many metrics from your Stripe account. The most important ones are shown on the Overview Tab, which is the default view when you open the app in your Stripe dashboard. It looks something like this:
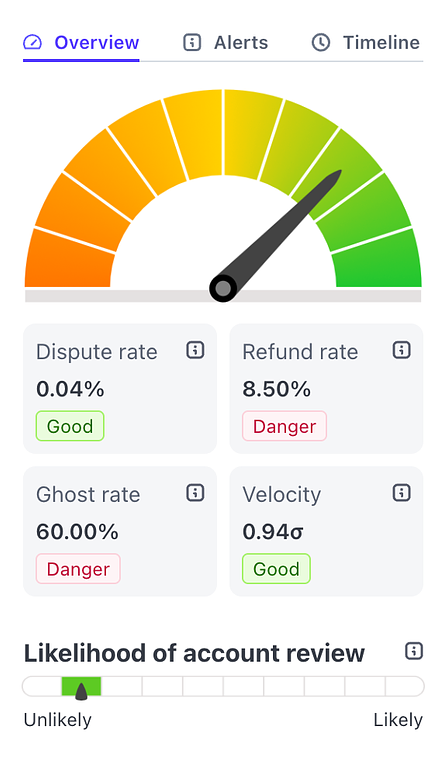 The Overview Tab
The Overview Tab
Advanced Metrics
If you scroll down below these basic metrics, you'll see a trend chart as well as many more metrics that Threshold has collected from your Stripe account data.
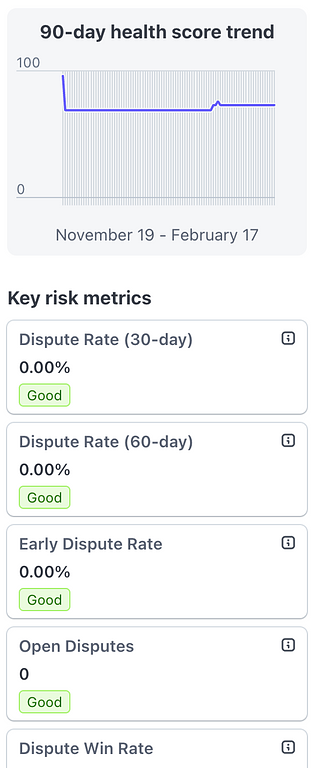 Score trend and metrics
Each of these advanced metrics plays a part in your overall health score. Each metric card has a helpful tooltip with a high level explanation to help you understand what is being measured. To see details on any of these stats, click or tap on the metric card.
You will see a new view with details specific to that metric:
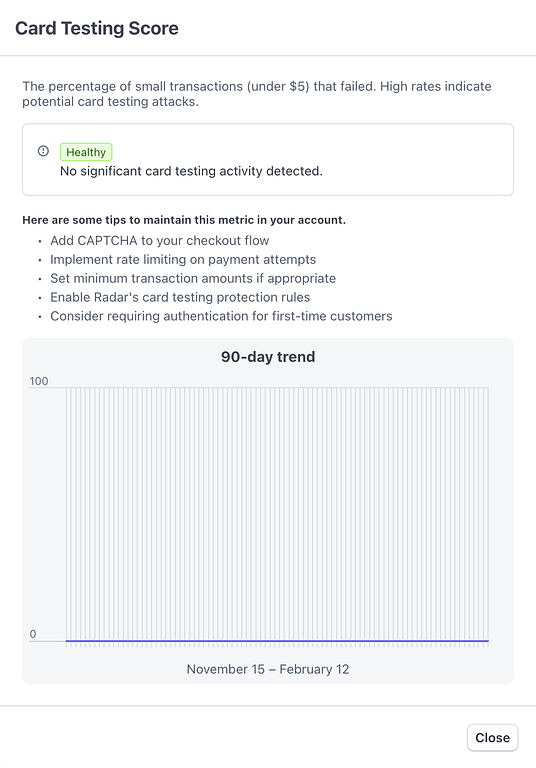 Card testing details
Each metric details view shows your current score as well as tips to maintain that particular metric. Use these detailed metric views to better understand how your account is performing in each area. If you notice a lower score on a metric, visit the details page to learn what you can do to improve the metric.
Note: not all metrics show trend graphs.
Some metrics offer specific action items you should take in your Stripe account (such as Radar rules or settings) that could immediately improve that metric for your account.
Score trend and metrics
Each of these advanced metrics plays a part in your overall health score. Each metric card has a helpful tooltip with a high level explanation to help you understand what is being measured. To see details on any of these stats, click or tap on the metric card.
You will see a new view with details specific to that metric:
Card testing details
Each metric details view shows your current score as well as tips to maintain that particular metric. Use these detailed metric views to better understand how your account is performing in each area. If you notice a lower score on a metric, visit the details page to learn what you can do to improve the metric.
Note: not all metrics show trend graphs.
Some metrics offer specific action items you should take in your Stripe account (such as Radar rules or settings) that could immediately improve that metric for your account.